


Financial analysis is a fundamental skill for effectively valuing a company. Though analysts typically learn these skills in college or on the job, the skills can be easily learned and applied through practice and patience. In terms of building an investment case, the first step in adding the numbers to the story is understanding the existing financial position of a company, its revenue growth, profitability, and free cash flow conversion. On the balance sheet, understanding critical factors like the company’s cash & debt positions, working capital, and fixed capital are crucial for understanding the foundation of the company.
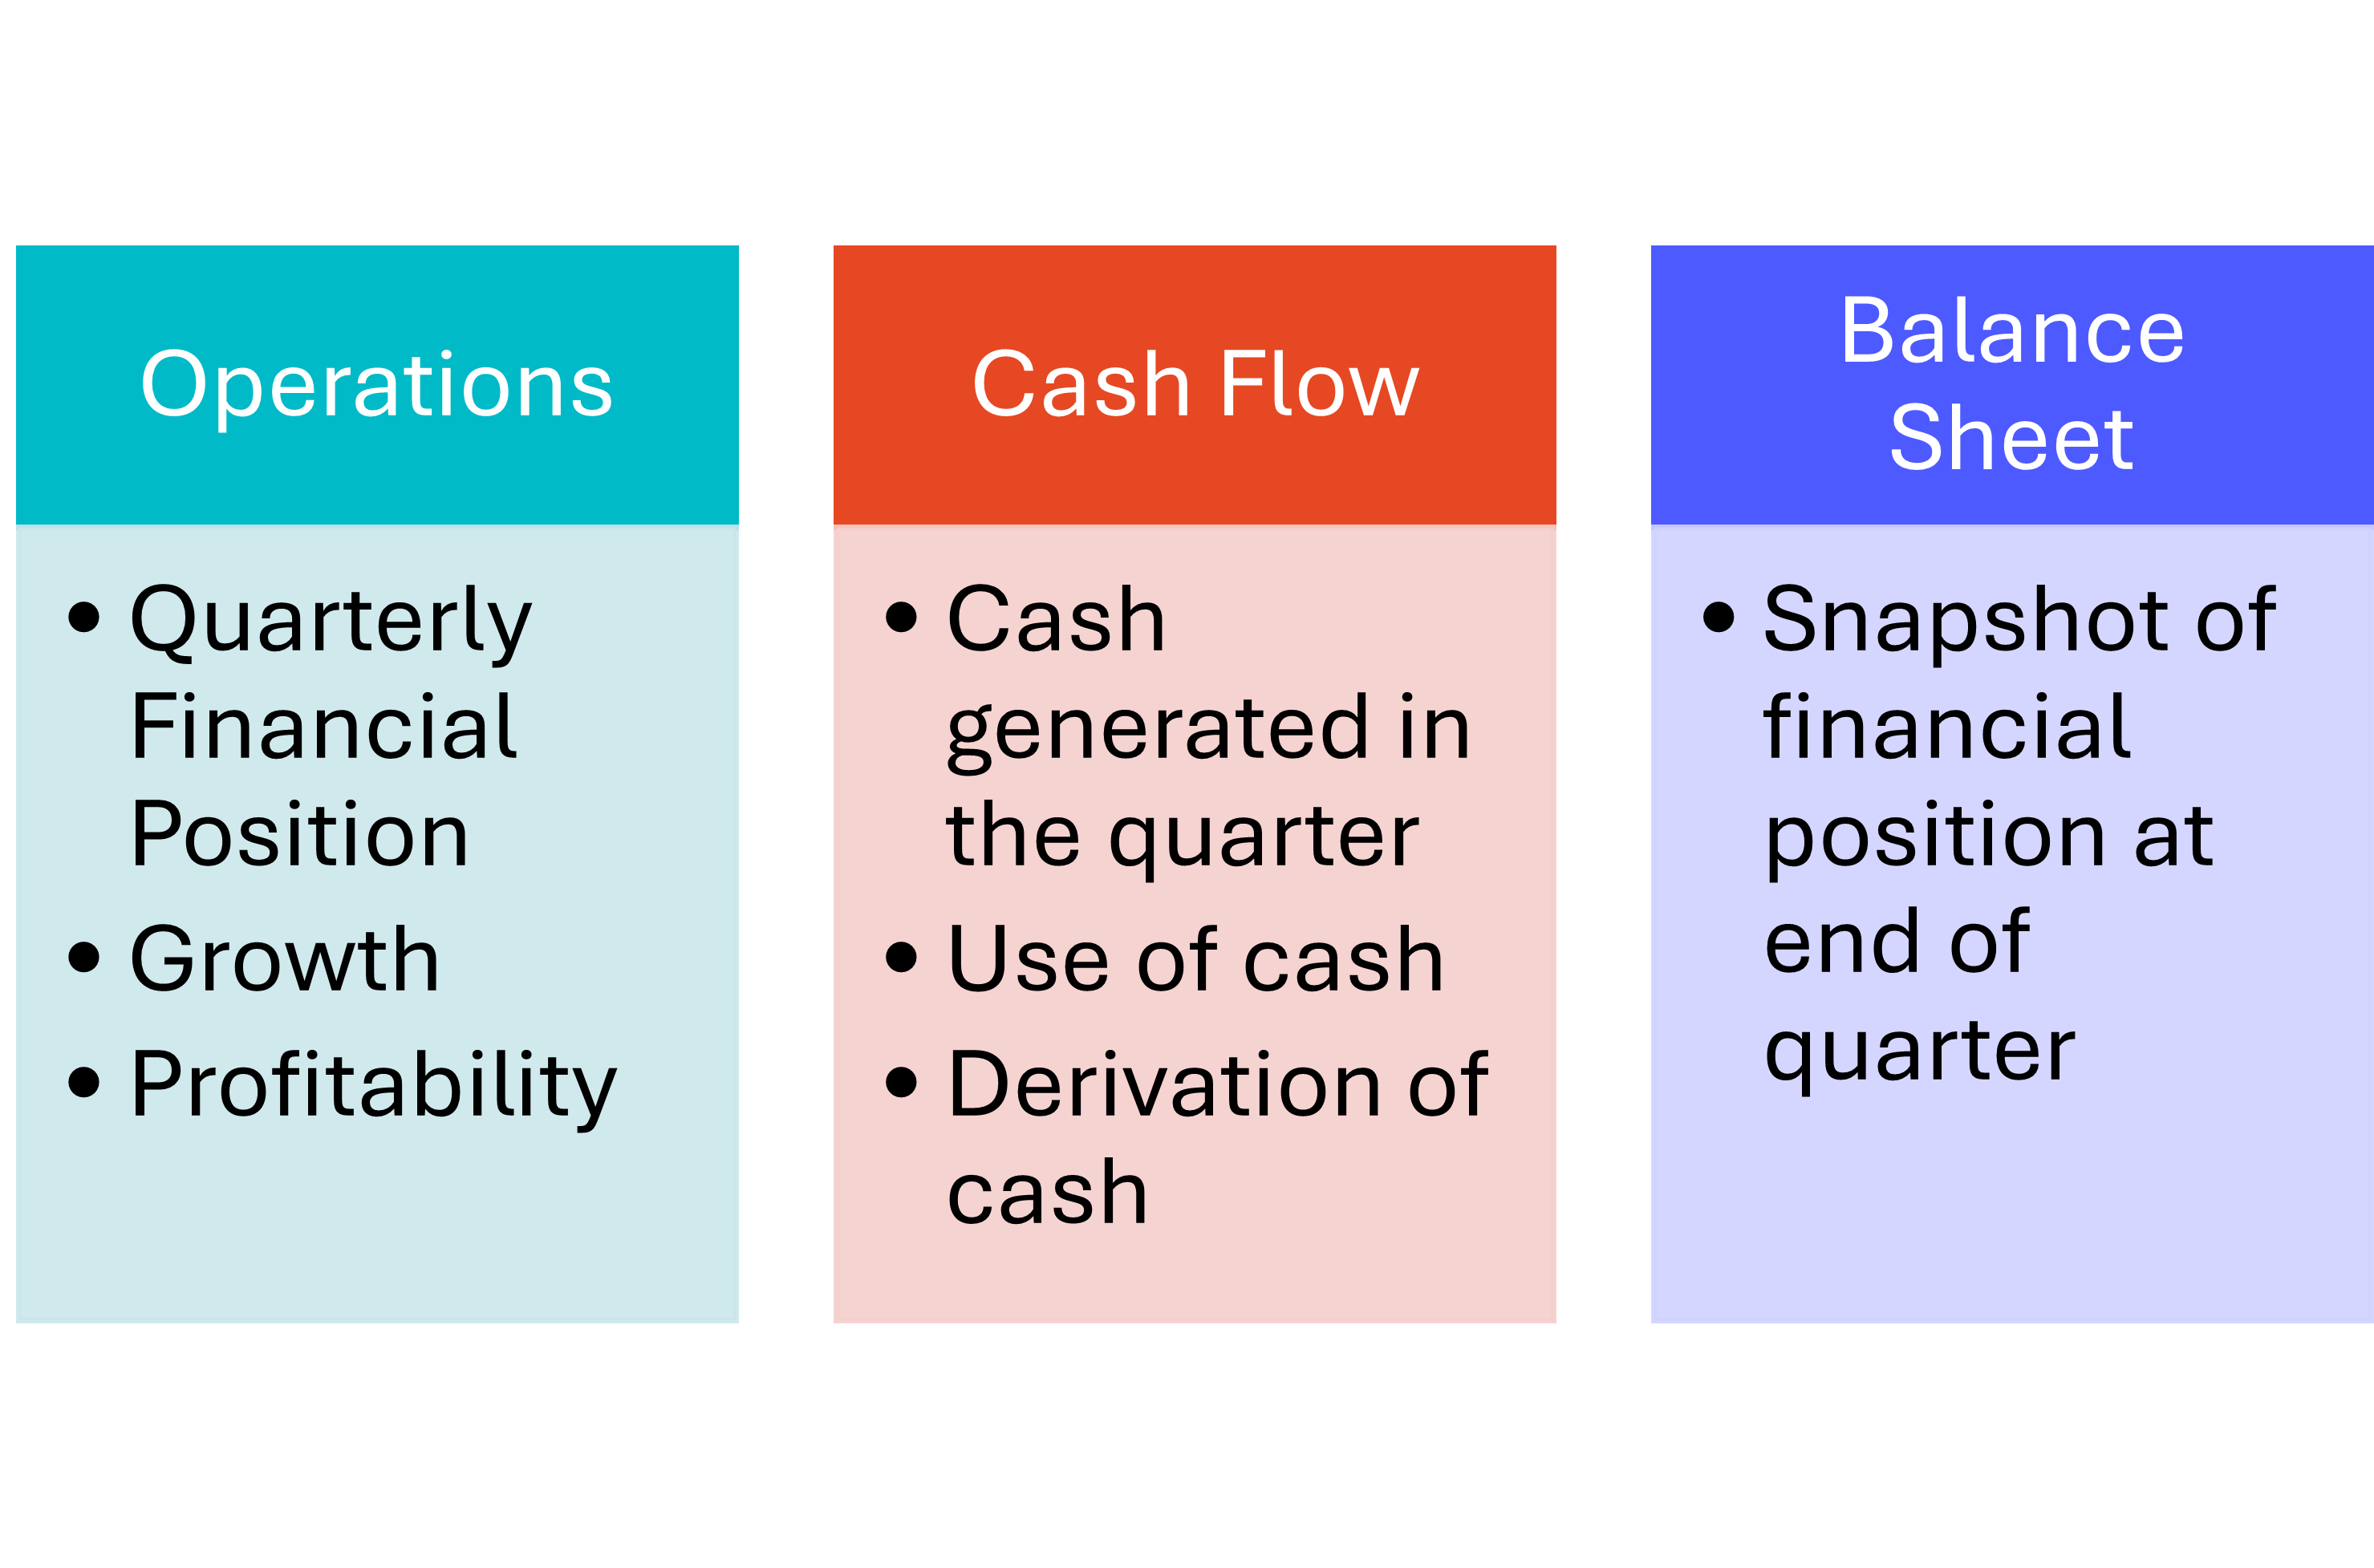
The purpose of this note is to explain how to understand the basics of a company’s financial reports at a high level. We’ll discuss the 3 financial statements and how to use them.
Statement of Operations
The statement of operations is the core component of equity research. This statement presents the company’s financial performance for the quarter or the full fiscal year, providing aggregated corporate data into a digestible statement. Companies with multiple business units will typically disaggregate revenue in a separate table, providing important information that can be used to understand the company’s growth drivers and how they may impact corporate margins. Segment data isn’t standardized from company to company, so gaining a 1:1 assessment across companies and business units may not provide a complete picture. Companies may include
Segment revenue
Segment costs and gross margins
Segment operating expenses and operating income
Segment depreciation & amortization and EBITDA
Segment net earnings
For all intents and purposes, you will be more likely to find the first 2-3 items in the list. Companies that present disaggregated EBITDA and net earnings typically fall more in the industrials sector and are typically more distinguished companies in terms of longevity.
Segment information can provide information that can help us with developing a financial model, such as growth drivers on a per-segment basis. Segment information can also help us forecast margins for the company depending on segment growth. For example, a technology company may parse out product vs. services revenue in which services revenue will drive stronger margins. If the company’s customers are expected to undergo a major product refresh, we could expect corporate margins to compress as product growth weighs more heavily into revenue mix. The closer to the bottom line the company presents segment information, the more accurately we can model the company’s operations.
For the purpose of analyzing a company’s income statement, key factors analysts will be looking for include revenue growth, margin expansion or contraction, use of non-operating expenses, and net earnings.
Assessing a company’s health can be an intricate matter and can be very situational. Cyclical companies may go through growth and contraction cycles, which should be expected. Looking at a company’s financial statements out of context will not provide material information for assessing the value of a company. If the industry is going through a contraction, tying the macroeconomic impact to the financial statement will determine whether the company is gaining or losing market share throughout the cycle.
In addition to this, we can assess whether the company is being managed adequately throughout the cycle. If management is cutting costs to match the downcycle, investors must question the severity of the cycle and whether the company will be positioned for the upcycle. In part, analyzing a company’s financials from cycle-to-cycle will be critical in determining whether management is improving operational efficiencies. If the company’s upcycle presents stronger margins than the previous upcycle, we can determine that operations may be stronger going into the peak of the cycle. If this is the case, we may be in a position to expect stronger earnings going forward that may be reflected in the share price.
Statement of Cash Flow
The statement of cash flow presents a more complete picture of the company’s financial position in terms of how the company generates cash. This statement begins where the statement of operations ends, at net earnings. From there, non-cash expenses are added back to net earnings followed by changes in working capital accounts.
In short, working capital is the difference between short-term assets and short-term liabilities. Analysts oftentimes take a high-level approach to modeling this portion through the use of the cash conversion cycle, analyzing receivables, inventories, and payables, and the quarter-to-quarter changes. Working capital will provide investors with how the company floats cash in order to cover internal expenses.
The cash flow statement also includes capital investments and divestments, as well as financing cash flows that may include debt issuances and distinguishments, dividend distributions, and equity purchases, amongst other items.
The cash flow statement concludes with the beginning and ending cash position. This ties directly into the balance sheet.
Balance Sheet
The balance sheet is a snapshot of the company’s financial position at the end of the quarter. Many of the items found in the cash flow statement will look familiar when analyzing the balance sheet as the cash flow statement will provide insights into the period changes of these accounts. At a glance, you can review the company’s cash position, debt position, its working capital position, and any abnormalities in the statement that may stick out, whether by industry standards or from previous periods presented by the company. Comparing a fabless semiconductor design company like Nvidia to Intel, which both designs and manufactures chips, you can see a significant difference in fixed assets, or the property, plant, and equipment account. Though the equity component of the balance sheet is critical for understanding the book value of the company, this section is typically only utilized by analysts to assess banks and financial institutions.
Overall, analyzing a company is more of an art than a science. The financial statements only tell a component of the larger story and cannot be analyzed without understanding the company’s products, industry, end market, or the broader macroeconomic picture.